By accommodating a wealth of accessories, the system can address any user’s applications and a variety of situations.
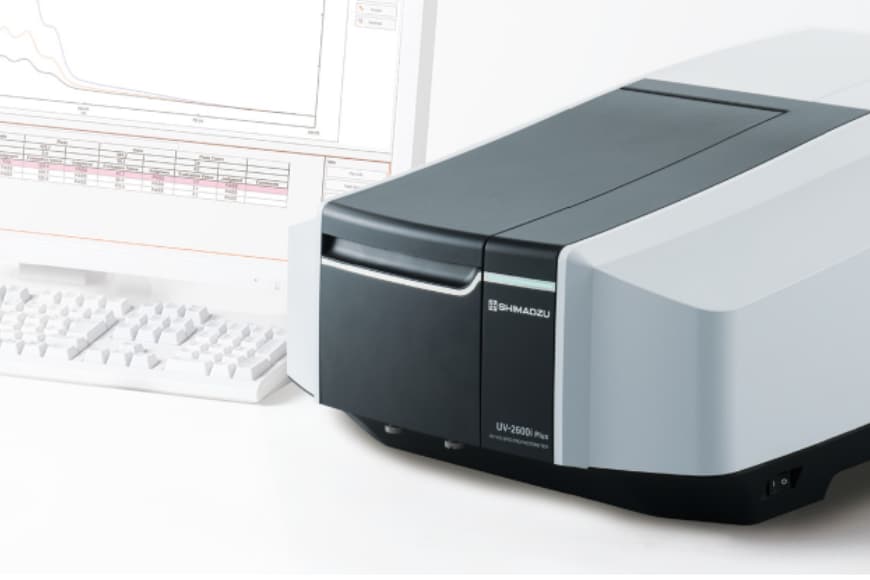
UV-Vis Spectrophotometer
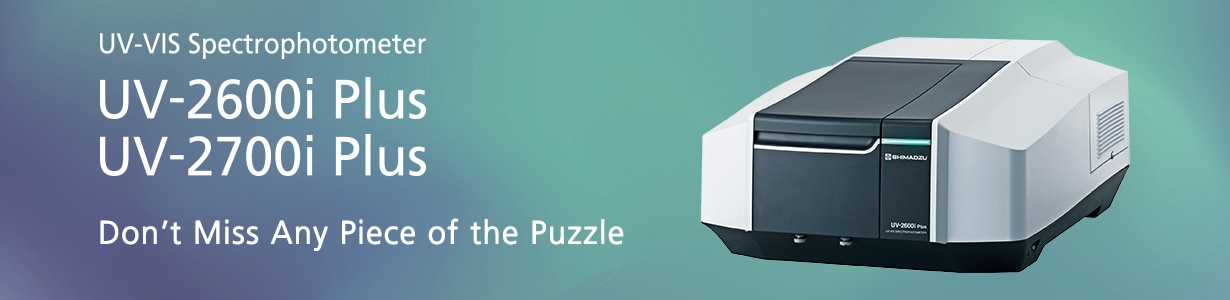
The UV-2600i Plus is a single monochromator system with an expandable wavelength range up to 1400 nm using an optional integrating sphere, making it adaptable for various needs.
The UV-2700i Plus is a double monochromator system capable of 8-Abs measurements, ideal for low transmittance samples.
Both models come equipped with the intuitive Shimadzu LabSolutions UV-Vis software, ensuring data integrity and ease of use. Additionally, these spectrophotometers can be scheduled to shut down or enter sleep mode to save power and lamp life, and can automatically wake up at a specified time, enhancing efficiency. Elevate your analysis with these versatile and efficient spectrophotometers.


2 Zero hunger

3 Good health and well-being

12 Responsible consumption and production